Edit chart
Loading graph
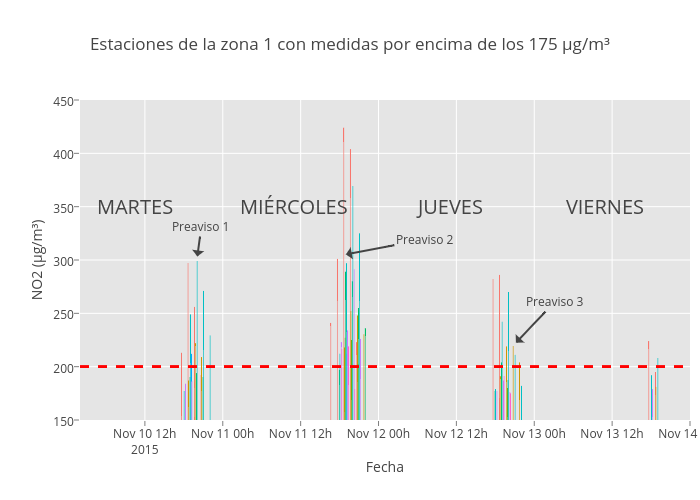
Maria_piperlab's interactive graph and data of "Estaciones de la zona 1 con medidas por encima de los 175 μg/m³" is a grouped bar chart, showing Ramón y Cajal, B. del Pilar, Castellana, Cuatro Caminos, Esc. Aguirre, Méndez Álvaro, Plaza Castilla, Pza. de España, Umbral preaviso; with Fecha in the x-axis and NO2 (μg/m³) in the y-axis.. The x-axis shows values from 1447117200000 to 1447455600000. The y-axis shows values from 150 to 450. This visualization has the following annotations: JUEVES; VIERNES; MIÉRCOLES; MARTES; Preaviso 1; Preaviso 2; Preaviso 3