Edit chart
Loading graph
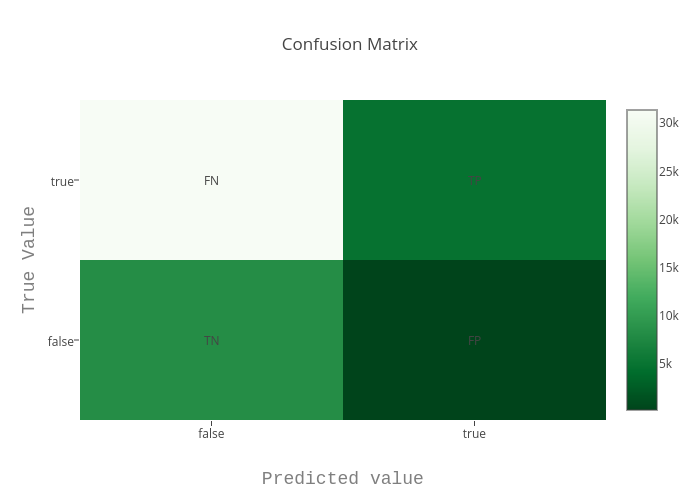
Margaretwm3's interactive graph and data of "Confusion Matrix" is a heatmap, showing trace0; with Predicted value in the x-axis and True Value in the y-axis.. The x-axis shows values from 0 to 0. The y-axis shows values from 0 to 0. This visualization has the following annotations: TN; FP; FN; TP