−60
−40
−20
0
20
40
60
80
100
0
5k
10k
15k
20k
25k
30k
0
100
200
300
400
500
600
700
Pressure (mmHg)
Pressure 2 (mmHg)
Pressure (mmHg) - fit 2
Pressure 2 (mmHg) - fit
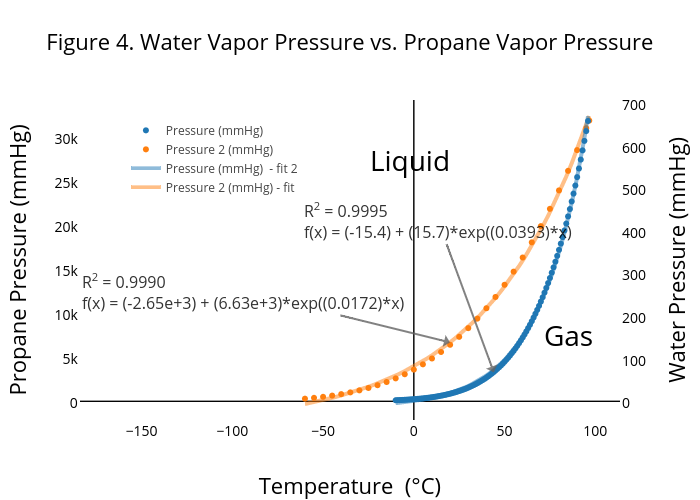
Figure 4. Water Vapor Pressure vs. Propane Vapor Pressure
Temperature (°C)
Propane Pressure (mmHg)
Water Pressure (mmHg)
R
2
= 0.9995
f(x) = (-15.4) + (15.7)*exp((0.0393)*x)
R
2
= 0.9990
f(x) = (-2.65e+3) + (6.63e+3)*exp((0.0172)*x)
Liquid
Gas
plotly-logomark
Edit chart
Madmehlberg's interactive graph and data of "Figure 4. Water Vapor Pressure vs. Propane Vapor Pressure" is a scatter chart, showing Pressure (mmHg) , Pressure 2 (mmHg), Pressure (mmHg) - fit 2, Pressure 2 (mmHg) - fit; with Temperature (°C) in the x-axis and Propane Pressure (mmHg) in the y-axis.. The x-axis shows values from -69.58129704301075 to 106.25129704301075. The y-axis shows values from -2099.3720027901227 to 34134.47367154277. This visualization has the following annotations: R2 = 0.9995f(x) = (-15.4) + (15.7)*exp((0.0393)*x); R2 = 0.9990f(x) = (-2.65e+3) + (6.63e+3)*exp((0.0172)*x); Liquid ; Gas