Edit chart
Loading graph
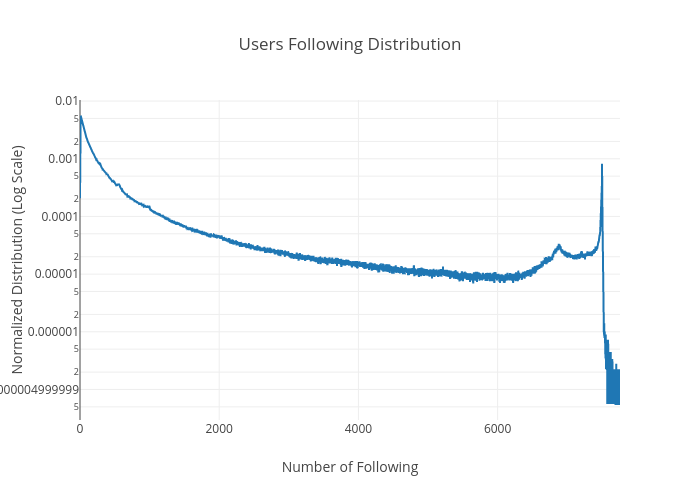
M30m's interactive graph and data of "Users Following Distribution" is a scatter chart; with Number of Following in the x-axis and Normalized Distribution (Log Scale) in the y-axis.. The x-axis shows values from 0 to 7758.237316345271. The y-axis shows values from -7.5290442546371645 to -1.9810856086323663.