Edit chart
Loading graph
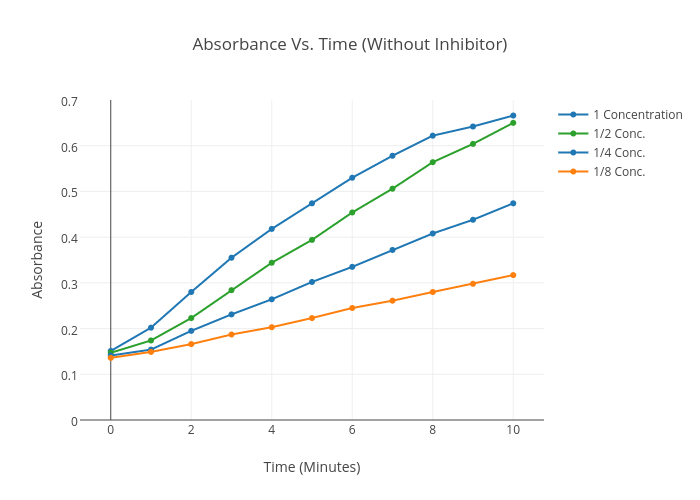
Lutzjake's interactive graph and data of "Absorbance Vs. Time (Without Inhibitor)" is a line chart, showing 1 Concentration, 1/2 Conc., 1/4 Conc., 1/8 Conc.; with Time (Minutes) in the x-axis and Absorbance in the y-axis.. The x-axis shows values from -0.5859982007033616 to 10.585998200703362. The y-axis shows values from 0 to 0.7.