Edit chart
Loading graph
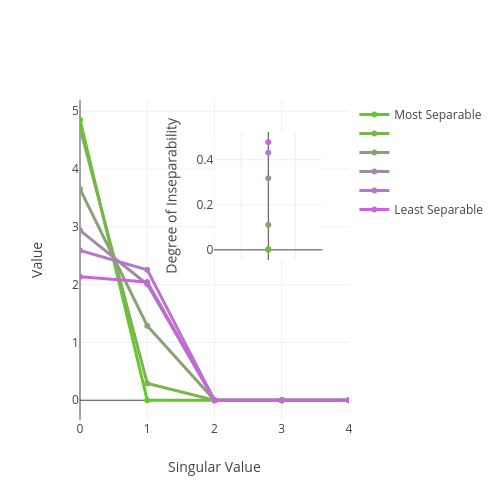
Lowell112's interactive graph and data of "Value vs Singular Value" is a scatter chart, showing Most Separable, , , , , Least Separable; with Singular Value in the x-axis and Value in the y-axis.. The x-axis shows values from 0 to 4. The y-axis shows values from 0 to 0.