Edit chart
Loading graph
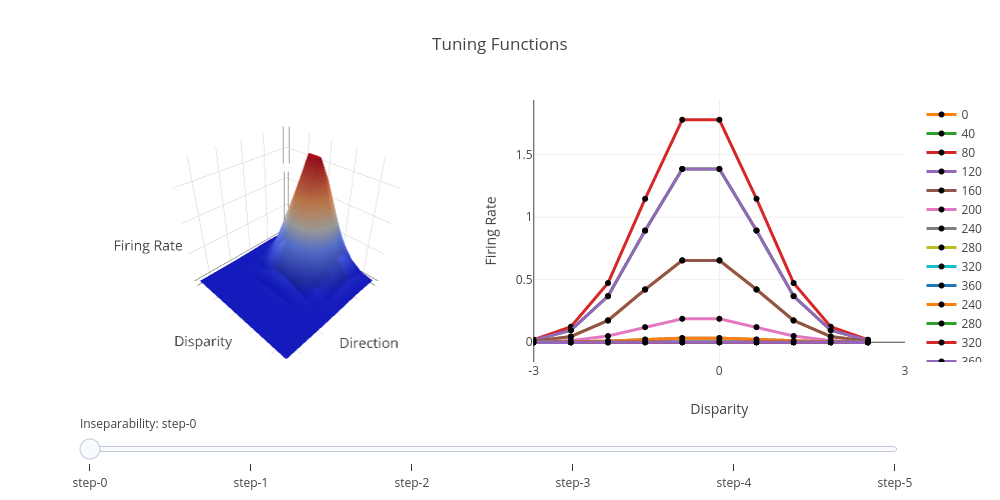
Lowell112's interactive graph and data of "Tuning Functions" is a surface, showing 0.0, 40.0, 80.0, 120.0, 160.0, 200.0, 240.0, 280.0, 320.0, 360.0, 240.0, 280.0, 320.0, 360.0. The x-axis shows values from 0 to 0. The y-axis shows values from 0 to 0.