Edit chart
Loading graph
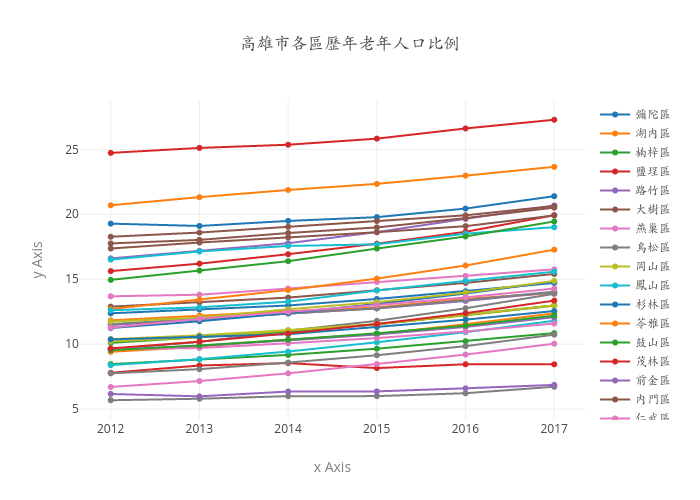
Logyuan2's interactive graph and data of "高雄市各區歷年老年人口比例" is a scatter chart, showing 彌陀區, 湖內區, 楠梓區, 鹽埕區, 路竹區, 大樹區, 燕巢區, 鳥松區, 岡山區, 鳳山區, 杉林區, 苓雅區, 鼓山區, 茂林區, 前金區, 內門區, 仁武區, 阿蓮區, 梓官區, 甲仙區, 前鎮區, 大社區, 新興區, 田寮區, 林園區, 旗山區, 左營區, 那瑪夏區, 橋頭區, 茄萣區, 永安區, 美濃區, 大寮區, 三民區, 桃源區, 六龜區, 旗津區, 小港區; with x Axis in the x-axis and y Axis in the y-axis.. The x-axis shows values from -0.64899713467 to 9.64899713467. The y-axis shows values from -0.646886016451 to 9.64688601645.