Edit chart
Loading graph
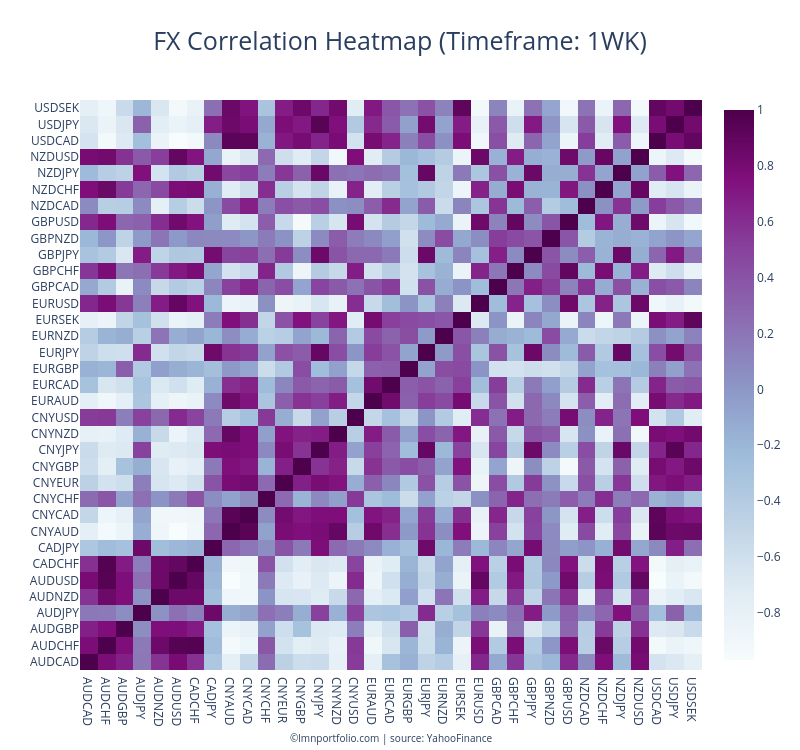
Lmnportfolio's interactive graph and data of "FX Correlation Heatmap (Timeframe: 1WK)" is a heatmap. The x-axis shows values from 0 to 0. The y-axis shows values from 0 to 0. This visualization has the following annotation: ©lmnportfolio.com | source: YahooFinance