Edit chart
Loading graph
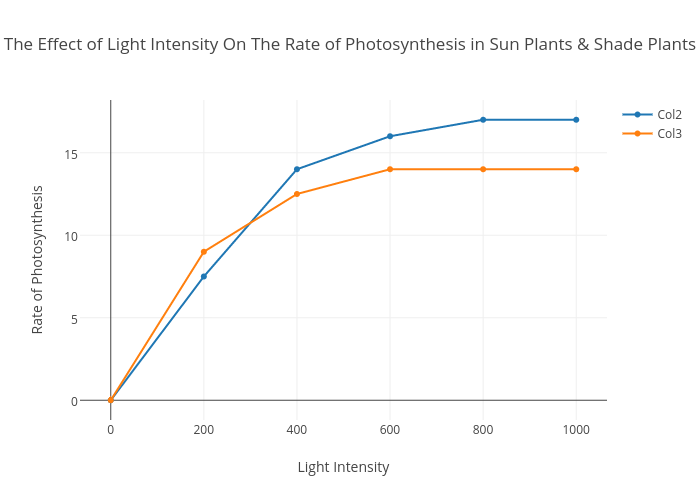
Liwyvannasha's interactive graph and data of "The Effect of Light Intensity On The Rate of Photosynthesis in Sun Plants & Shade Plants" is a scatter chart, showing Col2 vs Col3; with Light Intensity in the x-axis and Rate of Photosynthesis in the y-axis.. The x-axis shows values from -69.59892146949781 to 1069.5989214694978. The y-axis shows values from -1.1695265332062281 to 18.169526533206227.