Edit chart
Loading graph
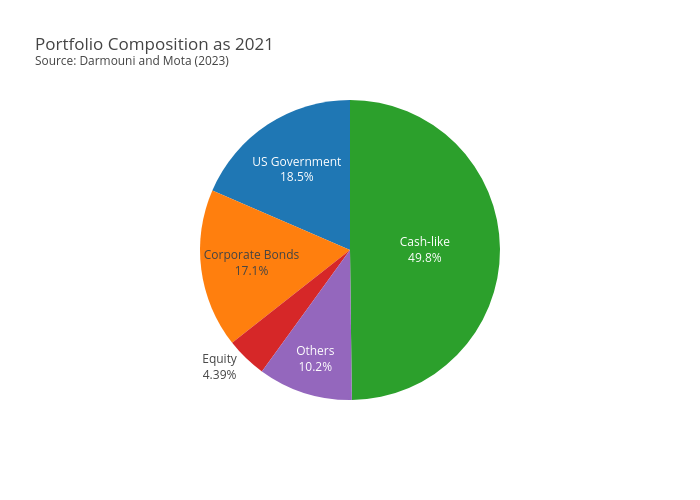
Liramota's interactive graph and data of "Portfolio Composition as 2021Source: Darmouni and Mota (2023)" is a pie. The x-axis shows values from 0 to 0. The y-axis shows values from 0 to 0.