Edit chart
Loading graph
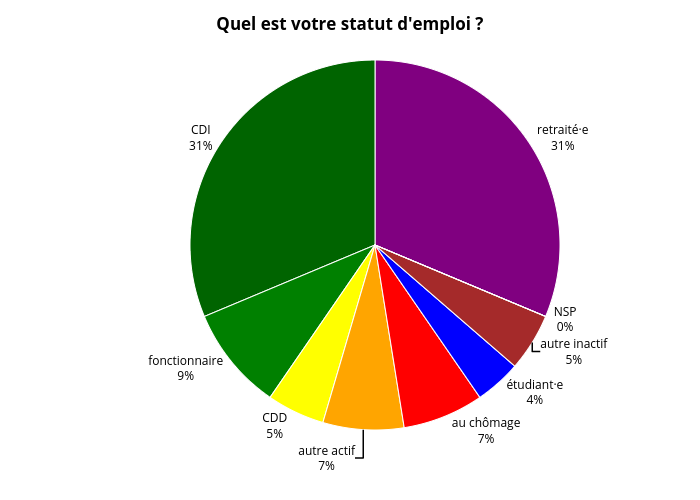
Lesgrains's interactive graph and data of "Quel est votre statut d'emploi ?" is a pie. The x-axis shows values from 0 to 0. The y-axis shows values from 0 to 0.