Edit chart
Loading graph
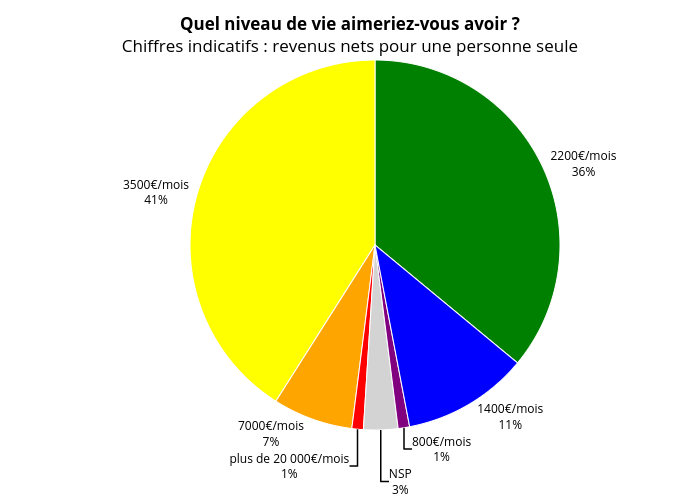
Lesgrains's interactive graph and data of "Quel niveau de vie aimeriez-vous avoir ?Chiffres indicatifs : revenus nets pour une personne seule" is a pie. The x-axis shows values from 0 to 0. The y-axis shows values from 0 to 0.