Edit chart
Loading graph
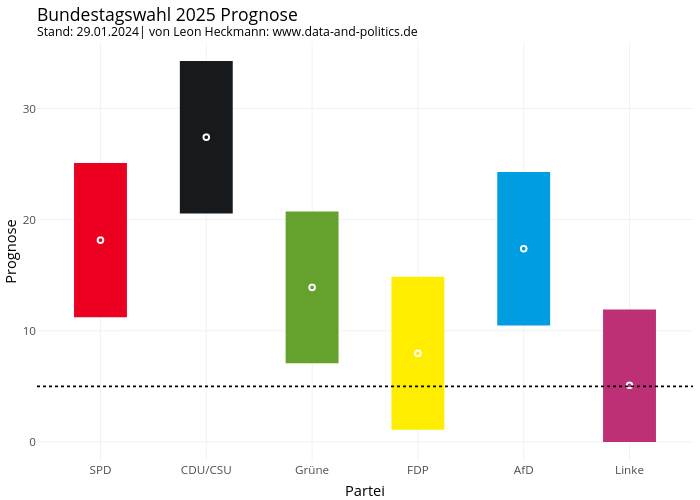
Leon.heckmann's interactive graph and data of "Bundestagswahl 2025 PrognoseStand: 29.01.2024| von Leon Heckmann: www.data-and-politics.de" is a filled line chart, showing SPD, CDU/CSU, Grüne, FDP, AfD, Linke, SPD, CDU/CSU, Grüne, FDP, AfD, Linke, SPD, CDU/CSU, Grüne, FDP, AfD, Linke; with Partei in the x-axis and Prognose in the y-axis.. The x-axis shows values from 0.4 to 6.6. The y-axis shows values from -1.713 to 35.973.