Edit chart
Loading graph
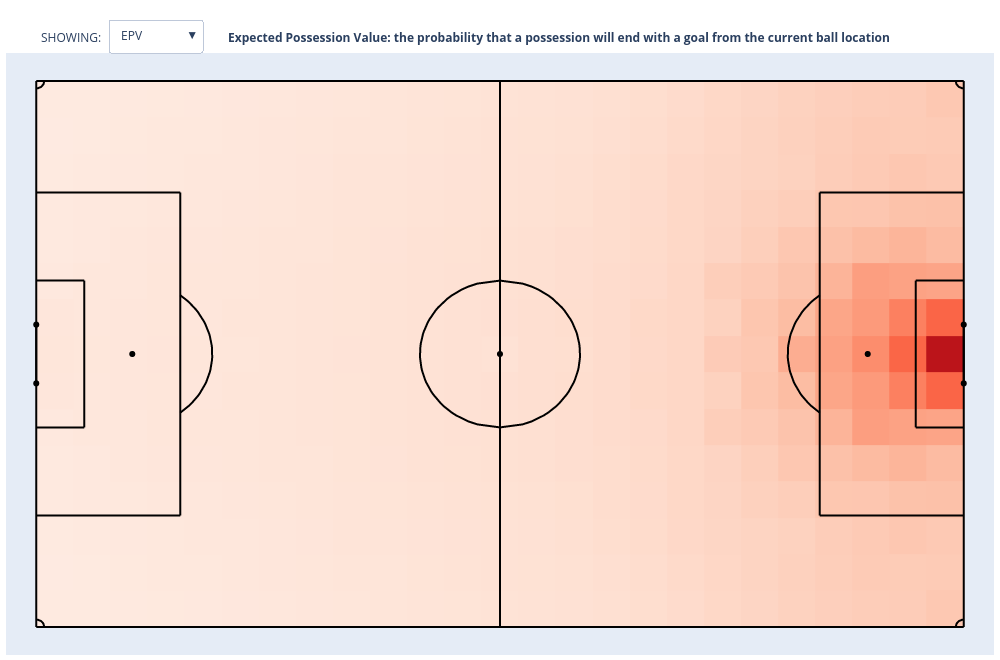
Laurieshaw's interactive graph and data of "EPV" is a line chart, showing EPV. The x-axis shows values from -56.0 to 56.0. The y-axis shows values from -37.0 to 37.0. This visualization has the following annotations: Expected Possession Value: the probability that a possession will end with a goal from the current ball location; SHOWING: