Edit chart
Loading graph
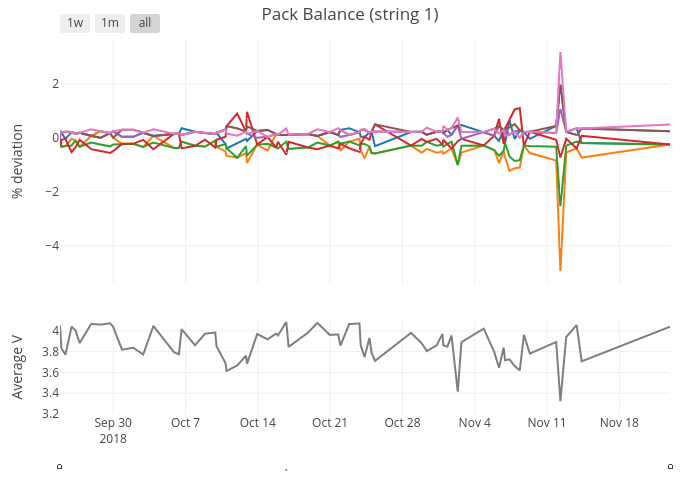
Latchacker's interactive graph and data of "Pack Balance (string 1)" is a line chart, showing pack A, pack B, pack C, pack D, pack E, pack F, pack G, Average pack V; with time in the x-axis and Average V in the y-axis.. The x-axis shows values from 2018-09-24 20:21 to 2018-11-12 06:57:53.4582. The y-axis shows values from 3.2 to 4.1.