Edit chart
Loading graph
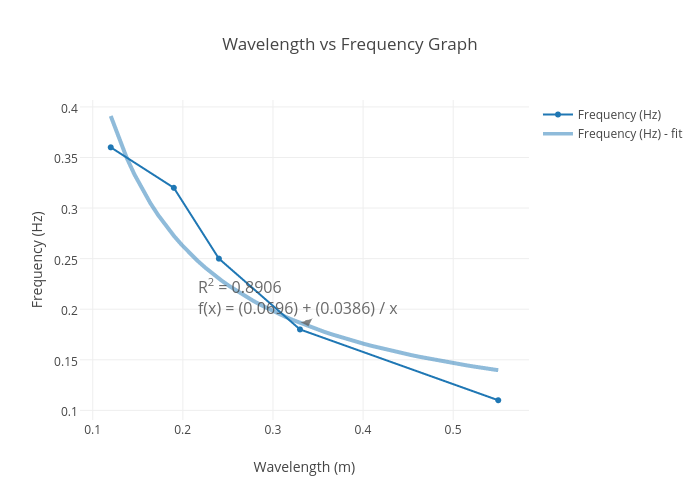
Ksdoh's interactive graph and data of "Wavelength vs Frequency Graph" is a line chart, showing Frequency (Hz) vs Frequency (Hz) - fit; with Wavelength (m) in the x-axis and Frequency (Hz) in the y-axis.. The x-axis shows values from 0.0937681443703413 to 0.5762318556296587. The y-axis shows values from 0.0907850585787261 to 0.40678433218924936. This visualization has the following annotation: R2 = 0.8906f(x) = (0.0696) + (0.0386) / x