Edit chart
Loading graph
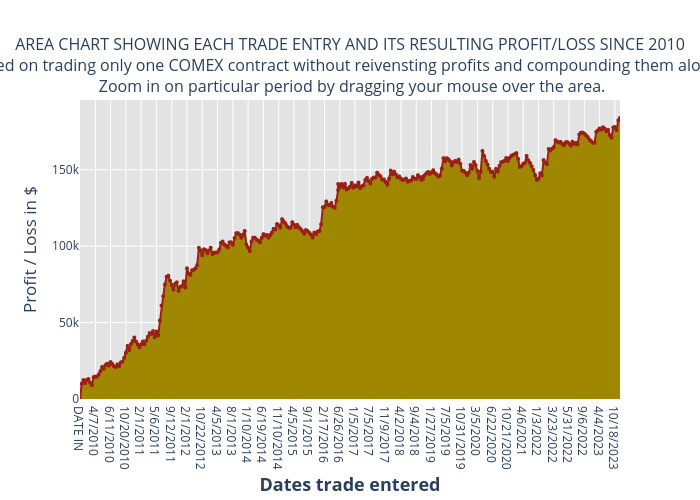
Konradu's interactive graph and data of "AREA CHART SHOWING EACH TRADE ENTRY AND ITS RESULTING PROFIT/LOSS SINCE 2010Data is based on trading only one COMEX contract without reivensting profits and compounding them along the way. Zoom in on particular period by dragging your mouse over the area." is a , showing Trade; with Dates trade entered in the x-axis and Profit / Loss in $ in the y-axis.. The x-axis shows values from 0 to 318. The y-axis shows values from 0 to 195129.2162671694.