Edit chart
Loading graph
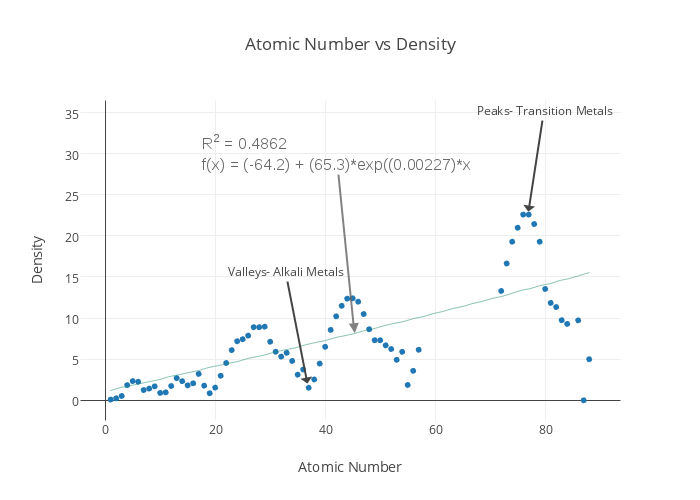
Kass's interactive graph and data of "Atomic Number vs Density" is a scatter chart, showing Col9 vs Col9 - fit; with Atomic Number in the x-axis and Density in the y-axis.. The x-axis shows values from -4.4081826831588975 to 93.4081826831589. The y-axis shows values from -2.7532038277139104 to 40.51142775064754. This visualization has the following annotations: R2 = 0.4862f(x) = (-64.2) + (65.3)*exp((0.00227)*x); Peaks- Transition Metals; Valleys- Alkali Metals