Edit chart
Loading graph
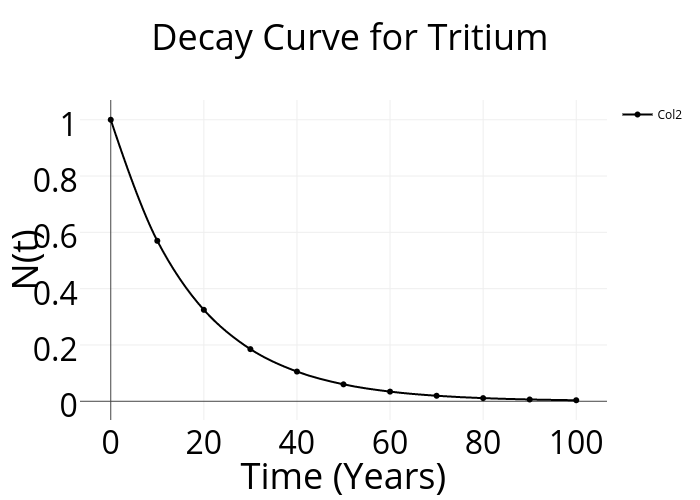
Kartikagrawal27's interactive graph and data of "Decay Curve for Tritium" is a scatter chart, showing Col2; with Time (Years) in the x-axis and N(t) in the y-axis.. The x-axis shows values from -5.881432817143751 to 105.88143281714375. The y-axis shows values from -0.05830995347222469 to 1.0619286853131342.