Edit chart
Loading graph
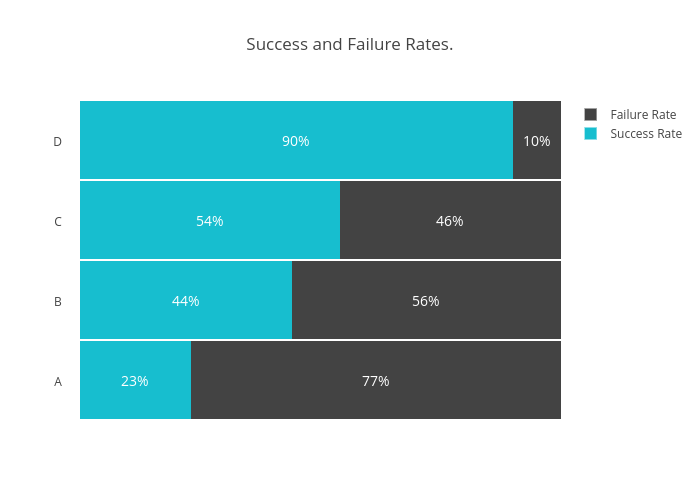
Kapslocked's interactive graph and data of "Success and Failure Rates." is a stacked bar chart, showing Success Rate vs Failure Rate; with in the y-axis. The x-axis shows values from 0 to 100. The y-axis shows values from -0.5 to 3.5. This visualization has the following annotations: 23%; 77%; 44%; 56%; 54%; 46%; 90%; 10%