Edit chart
Loading graph
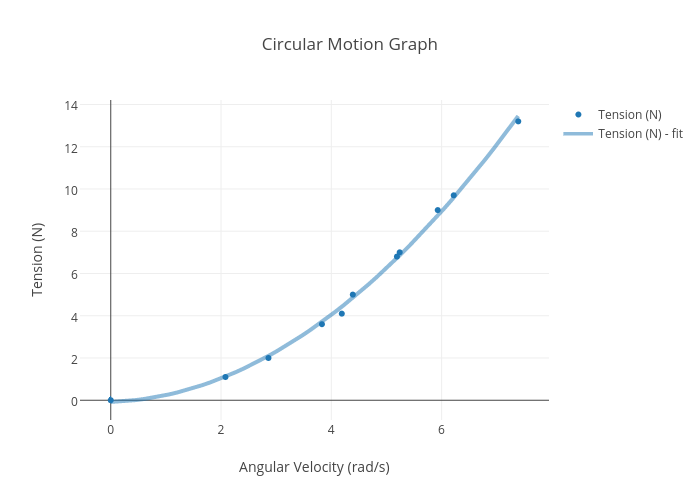
Kamilla5837's interactive graph and data of "Circular Motion Graph" is a scatter chart, showing Tension (N) vs Tension (N) - fit; with Angular Velocity (rad/s) in the x-axis and Tension (N) in the y-axis.. The x-axis shows values from -0.4564379377142006 to 7.8464379377142. The y-axis shows values from -0.8988262025291734 to 14.209103584663316.