Edit chart
Loading graph
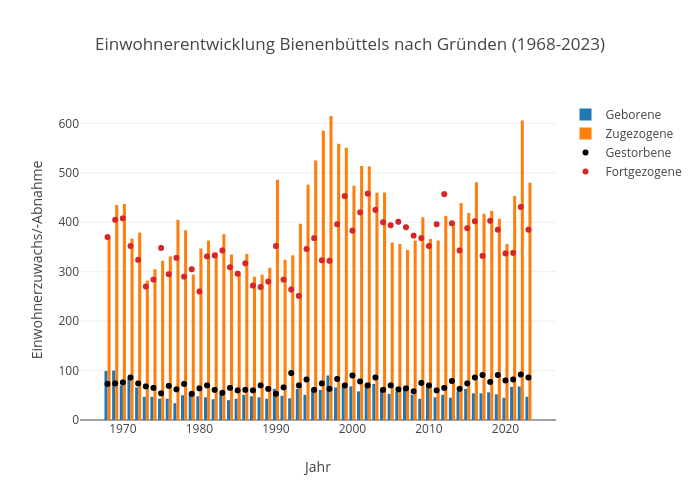
Kalapuskin's interactive graph and data of "Einwohnerentwicklung Bienenbüttels nach Gründen (1968-2023)" is a bar chart, showing Geborene, Zugezogene, Gestorbene, Fortgezogene; with Jahr in the x-axis and Einwohnerzuwachs/-Abnahme in the y-axis.. The x-axis shows values from 1964.7339487462111 to 2026.2660512537889. The y-axis shows values from 0 to 647.3684210526316.