Edit chart
Loading graph
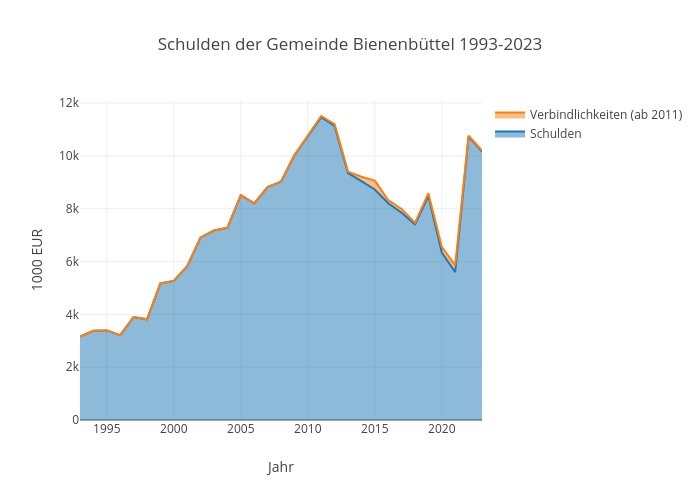
Kalapuskin's interactive graph and data of "Schulden der Gemeinde Bienenbüttel 1993-2023" is a line chart, showing Schulden vs Verbindlichkeiten (ab 2011); with Jahr in the x-axis and 1000 EUR in the y-axis.. The x-axis shows values from 1993 to 2023. The y-axis shows values from 0 to 12113.684210526315.