Edit chart
Loading graph
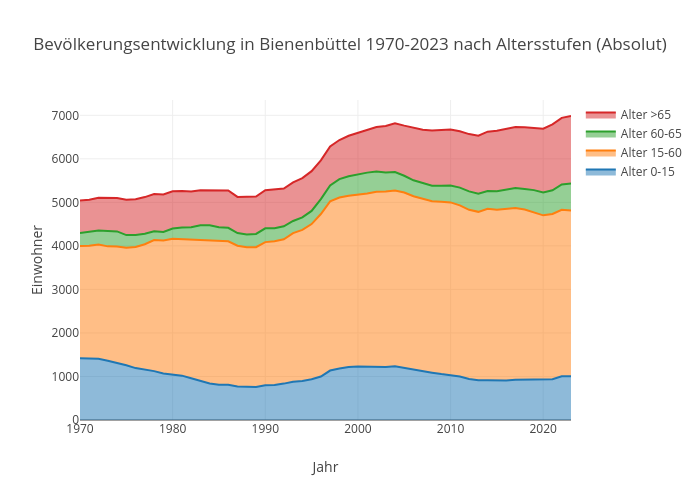
Kalapuskin's interactive graph and data of "Bevölkerungsentwicklung in Bienenbüttel 1970-2023 nach Altersstufen (Absolut)" is a line chart, showing Alter 0-15, Alter 15-60, Alter 60-65, Alter >65; with Jahr in the x-axis and Einwohner in the y-axis.. The x-axis shows values from 1970 to 2023. The y-axis shows values from 0 to 7351.578947368421.