Edit chart
Loading graph
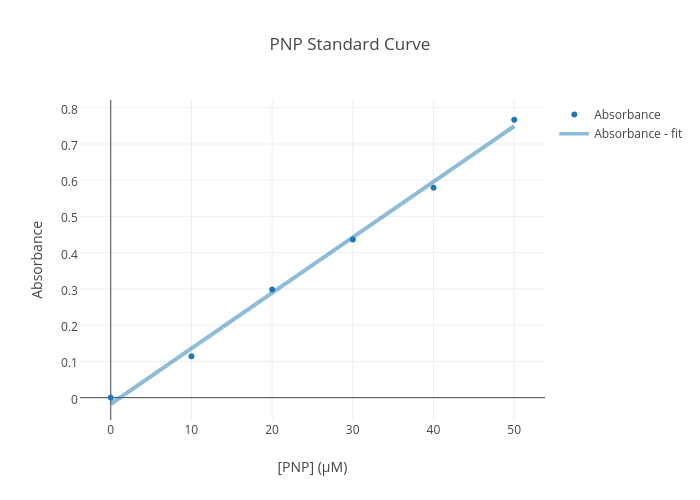
K13sa02's interactive graph and data of "PNP Standard Curve" is a scatter chart, showing Absorbance vs Absorbance - fit; with [PNP] (μM) in the x-axis and Absorbance in the y-axis.. The x-axis shows values from -3.5983066792097835 to 53.598306679209784. The y-axis shows values from -0.06185539413505496 to 0.824300107613667.