Edit chart
Loading graph
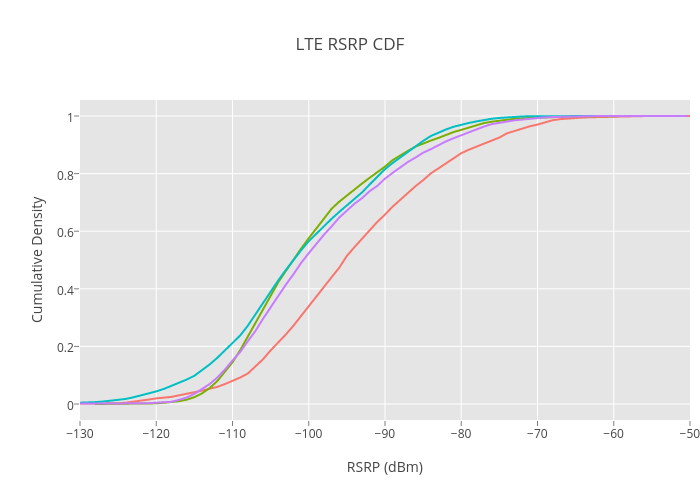
Jtostenr's interactive graph and data of "LTE RSRP CDF" is a line chart, showing 1, 2, 3, 4; with RSRP (dBm) in the x-axis and Cumulative Density in the y-axis.. The x-axis shows values from -130 to -50. The y-axis shows values from -0.05555555555555556 to 1.0555555555555556.