Edit chart
Loading graph
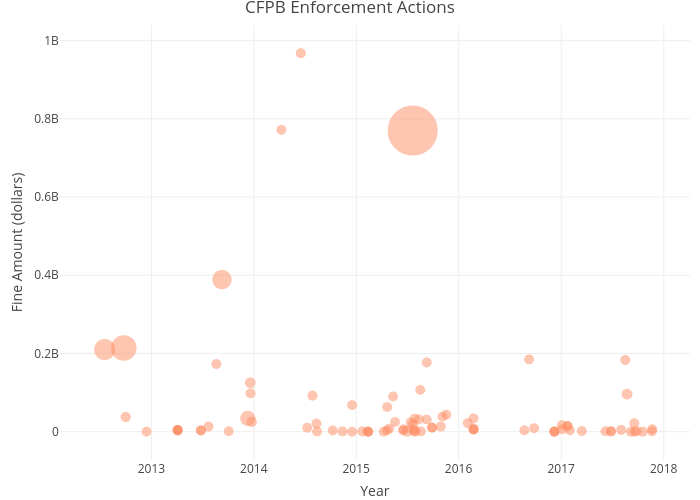
Jrobinsonneweconomy's interactive graph and data of "CFPB Enforcement Actions" is a scatter chart, showing coral1; with Year in the x-axis and Fine Amount (dollars) in the y-axis.. The x-axis shows values from 0 to 0. The y-axis shows values from 0 to 0.