Edit chart
Loading graph
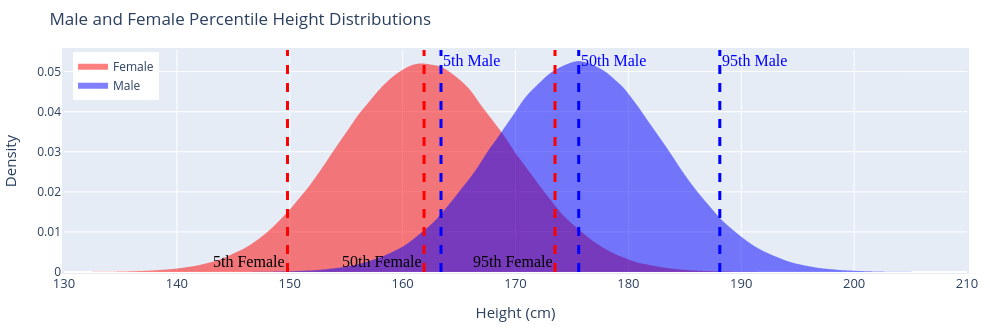
Jrkagumba's interactive graph and data of "Male and Female Percentile Height Distributions" is a filled , showing Female vs Male; with Height (cm) in the x-axis and Density in the y-axis.. The x-axis shows values from 130 to 210. The y-axis shows values from 0 to 0. This visualization has the following annotations: 5th Male; 50th Male; 95th Male; 5th Female; 50th Female; 95th Female