Edit chart
Loading graph
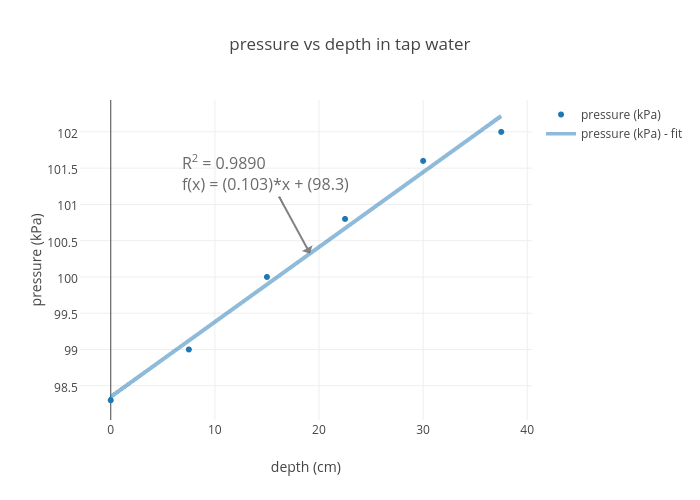
Jpgorski's interactive graph and data of "pressure vs depth in tap water" is a scatter chart, showing pressure (kPa) vs pressure (kPa) - fit; with depth (cm) in the x-axis and pressure (kPa) in the y-axis.. The x-axis shows values from -2.3680973209404046 to 39.86809732094041. The y-axis shows values from 98.01383084890696 to 102.44037481747604. This visualization has the following annotation: R2 = 0.9890f(x) = (0.103)*x + (98.3)