Edit chart
Loading graph
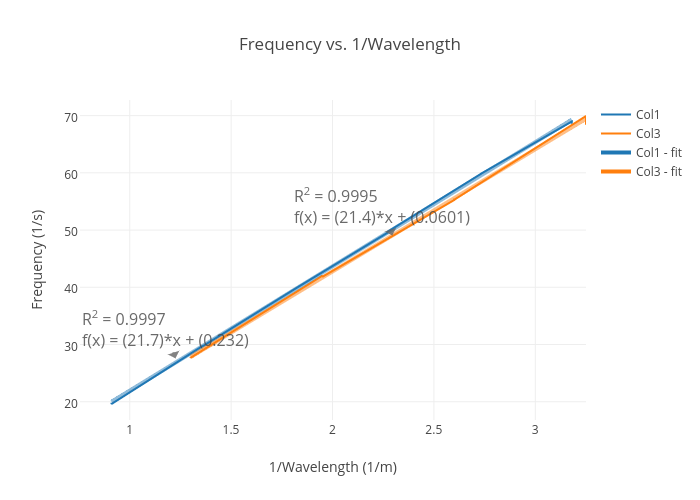
Jolienieweenie's interactive graph and data of "Frequency vs. 1/Wavelength" is a scatter chart, showing Col1, Col3, Col1 - fit, Col3 - fit; with 1/Wavelength (1/m) in the x-axis and Frequency (1/s) in the y-axis.. The x-axis shows values from 0.91 to 3.25. The y-axis shows values from 16.81216387388889 to 72.72574919611111. This visualization has the following annotations: R2 = 0.9997f(x) = (21.7)*x + (0.232); R2 = 0.9995f(x) = (21.4)*x + (0.0601)