Edit chart
Loading graph
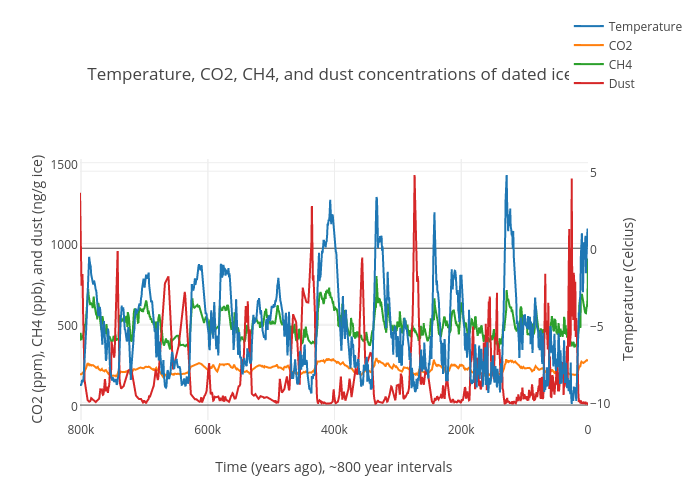
Johnjohn2139's interactive graph and data of "Temperature, CO2, CH4, and dust concentrations of dated ice core" is a scatter chart, showing Temperature, CO2, CH4, Dust; with Time (years ago), ~800 year intervals in the x-axis and CO2 (ppm), CH4 (ppb), and dust (ng/g ice) in the y-axis.. The x-axis shows values from 801662 to 38.3738. The y-axis shows values from -72.18017555555556 to 1502.6305355555558.