Edit chart
Loading graph
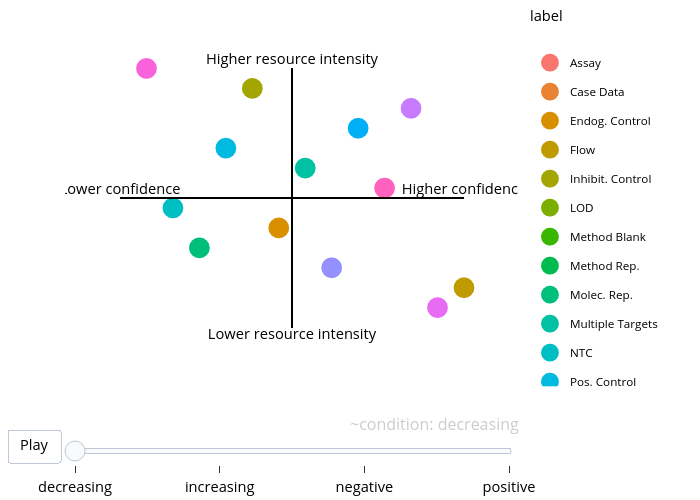
Jmcclary's interactive graph and data of "Assay, Case Data, Endog. Control, Flow, Inhibit. Control, LOD, Method Blank, Method Rep., Molec. Rep., Multiple Targets, NTC, Pos. Control, Recov. Control, RNA Conc., Sample Location, Sample Rep., Sample Type/Storage, Seq., Signal Strength, Std. Curve" is a scatter chart, showing Assay, Case Data, Endog. Control, Flow, Inhibit. Control, LOD, Method Blank, Method Rep., Molec. Rep., Multiple Targets, NTC, Pos. Control, Recov. Control, RNA Conc., Sample Location, Sample Rep., Sample Type/Storage, Seq., Signal Strength, Std. Curve. The x-axis shows values from -0.16 to 1.16. The y-axis shows values from -0.16 to 1.16. This visualization has the following annotation: label