Edit chart
Loading graph
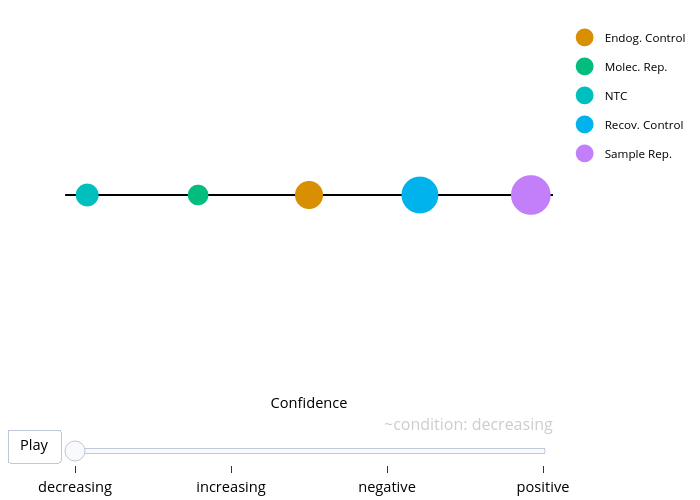
Jmcclary's interactive graph and data of "Endog. Control, Molec. Rep., NTC, Recov. Control, Sample Rep." is a line chart, showing Endog. Control, Molec. Rep., NTC, Recov. Control, Sample Rep.; with Confidence in the x-axis. The x-axis shows values from 0.8 to 5.2. The y-axis shows values from 0.95 to 1.05.