Edit chart
Loading graph
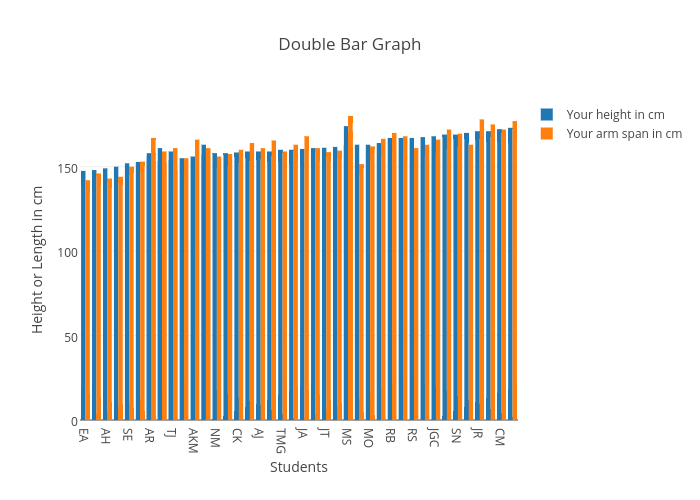
Jlucia's interactive graph and data of "Double Bar Graph" is a bar chart, showing Your height in cm vs Your arm span in cm; with Students in the x-axis and Height or Length in cm in the y-axis.. The x-axis shows values from -0.5 to 39.5. The y-axis shows values from 0 to 189.47368421052633.