100
200
300
400
500
600
700
0.016
0.018
0.02
0.022
0.024
0.026
0.028
0.03
0.032
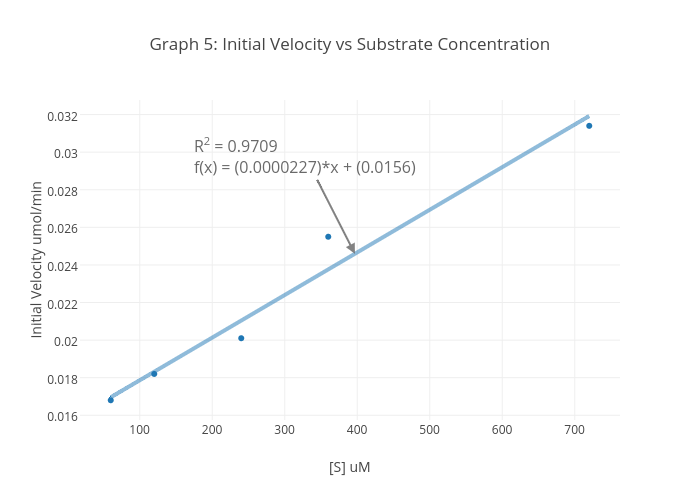
Graph 5: Initial Velocity vs Substrate Concentration
[S] uM
Initial Velocity umol/min
R
2
= 0.9709
f(x) = (0.0000227)*x + (0.0156)
plotly-logomark
Edit chart
Jkuhn's interactive graph and data of "Graph 5: Initial Velocity vs Substrate Concentration" is a scatter chart, showing Col2 vs Col2 - fit; with [S] uM in the x-axis and Initial Velocity umol/min in the y-axis.. The x-axis shows values from 18.433992517370385 to 761.5660074826296. The y-axis shows values from 0.015829584156148935 to 0.03277074210812511. This visualization has the following annotation: R2 = 0.9709f(x) = (0.0000227)*x + (0.0156)