Edit chart
Loading graph
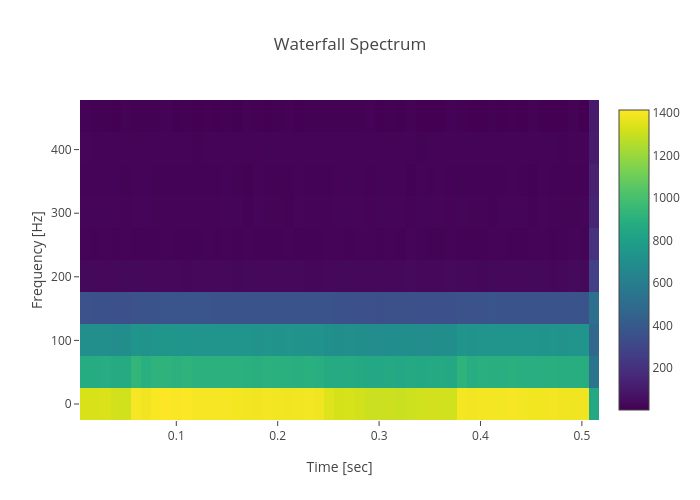
Jfs_discovergy's interactive graph and data of "Waterfall Spectrum" is a heatmap; with Time [sec] in the x-axis and Frequency [Hz] in the y-axis.. The x-axis shows values from 0.005018382352941176 to 0.5168933823529411. The y-axis shows values from 0 to 100.62893081761007.