Edit chart
Loading graph
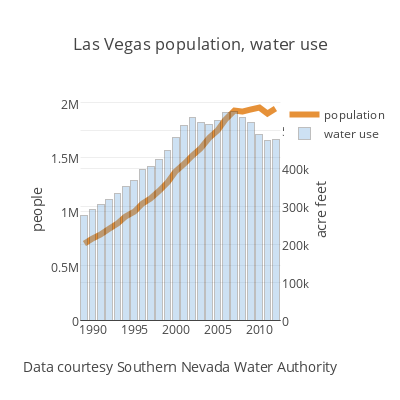
Jfleck's interactive graph and data of "Las Vegas population, water use" is a scatter chart, showing population vs water use; with Data courtesy Southern Nevada Water Authority in the x-axis and people in the y-axis.. The x-axis shows values from 1988.5 to 2012.5. The y-axis shows values from 0 to 2026260.0555555555.