Edit chart
Loading graph
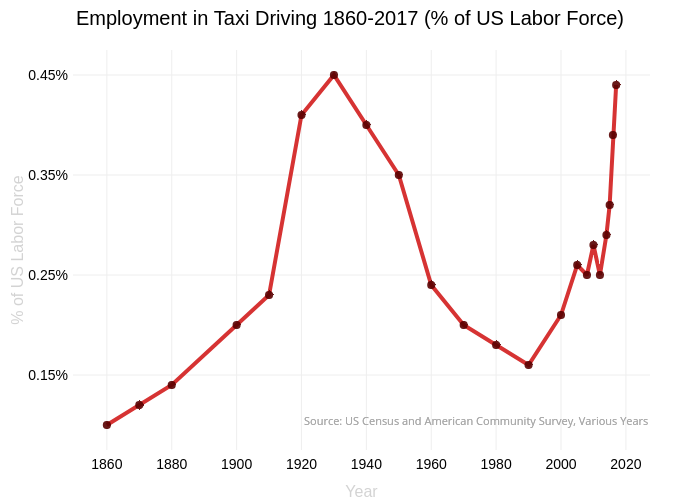
Jezras's interactive graph and data of "Employment in Taxi Driving 1860-2017 (% of US Labor Force)" is a line chart; with Year in the x-axis and % of US Labor Force in the y-axis.. The x-axis shows values from 0 to 0. The y-axis shows values from 0 to 0. This visualization has the following annotations: Source: US Census and American Community Survey, Various Years; Source: US Census and American Community Survey, Various Years