Edit chart
Loading graph
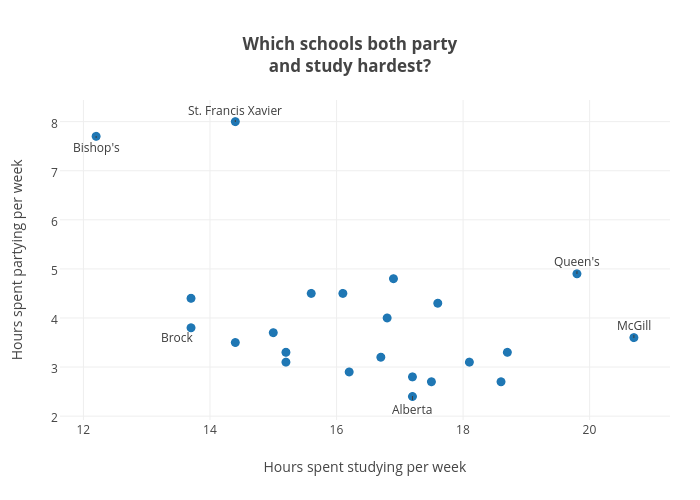
Jasonkirby's interactive graph and data of "Which schools both partyand study hardest?" is a scatter chart, showing C; with Hours spent studying per week in the x-axis and Hours spent partying per week in the y-axis.. The x-axis shows values from 11.682354324312769 to 21.21764567568723. The y-axis shows values from 2.0235842895792517 to 8.376415710420748. This visualization has the following annotations: Queen's; St. Francis Xavier; McGill; Alberta; Brock; Bishop's