Edit chart
Loading graph
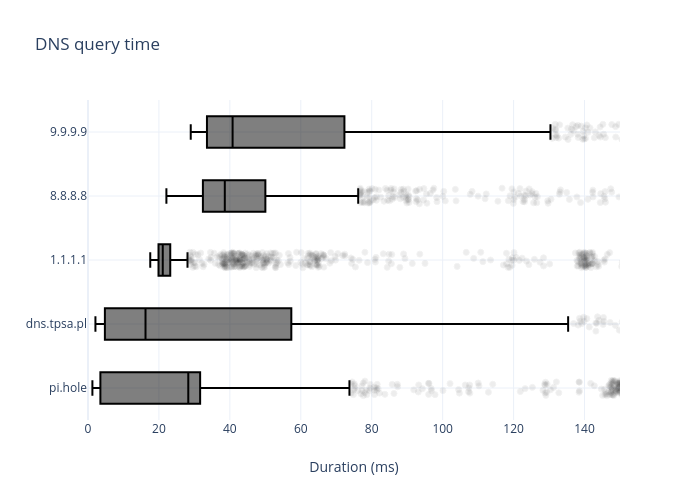
Janisz's interactive graph and data of "DNS query time " is a box plot; with Duration (ms) in the x-axis. The x-axis shows values from 0 to 150. The y-axis shows values from -0.5 to 4.5.