Edit chart
Loading graph
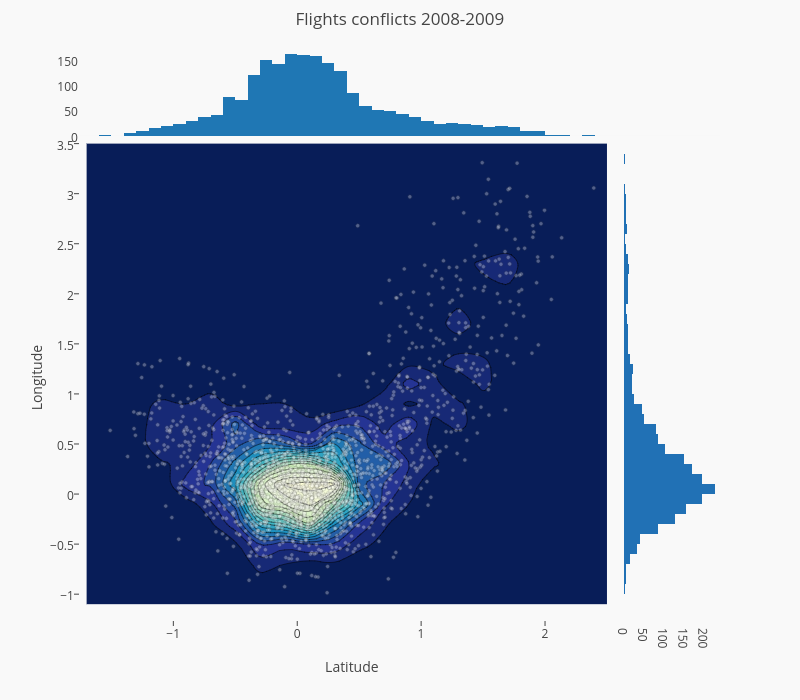
Jackp's interactive graph and data of "Flights conflicts 2008-2009" is a scatter chart, showing points, density, x density, y density; with Latitude in the x-axis and Longitude in the y-axis.. The x-axis shows values from -1.7534109496230226 to 2.637431338094243. The y-axis shows values from -1.2579644756759842 to 3.5809532695595134.