Edit chart
Loading graph
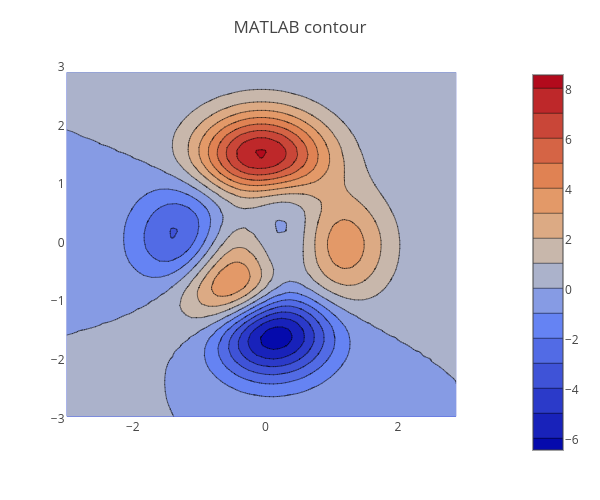
Jackp's interactive graph and data of "MATLAB contour" is a contour. The x-axis shows values from -3 to 3. The y-axis shows values from -3 to 3.