Edit chart
Loading graph
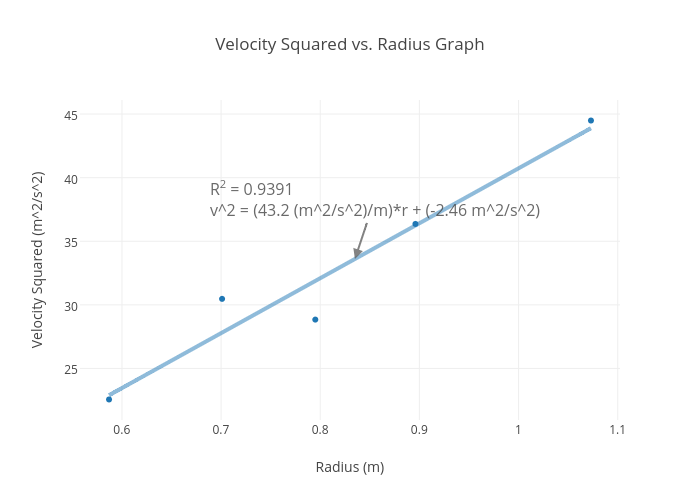
Ivandao97's interactive graph and data of "Velocity Squared vs. Radius Graph " is a scatter chart, showing Col1 vs Col1 - fit; with Radius (m) in the x-axis and Velocity Squared (m^2/s^2) in the y-axis.. The x-axis shows values from 0.5577126397831245 to 1.1022873602168755. The y-axis shows values from 20.946103896103907 to 46.103896103896105. This visualization has the following annotation: R2 = 0.9391v^2 = (43.2 (m^2/s^2)/m)*r + (-2.46 m^2/s^2)