Edit chart
Loading graph
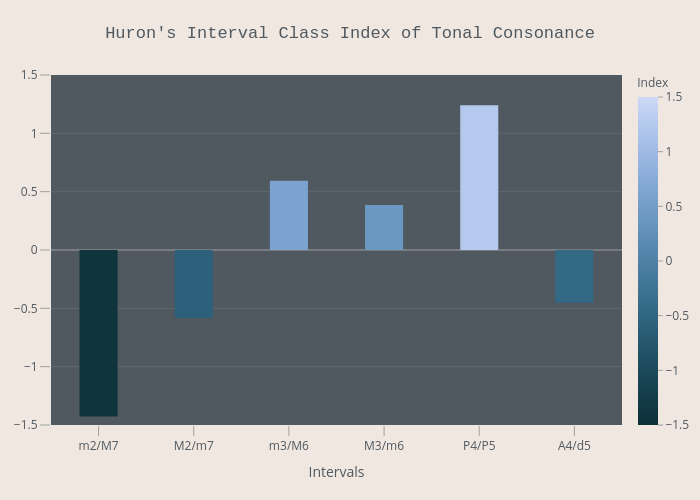
Inthefold's interactive graph and data of "Huron's Interval Class Index of Tonal Consonance" is a filled bar chart, showing Consonance Index; with Intervals in the x-axis. The x-axis shows values from -0.5 to 5.5. The y-axis shows values from -1.5 to 1.5.