Edit chart
Loading graph
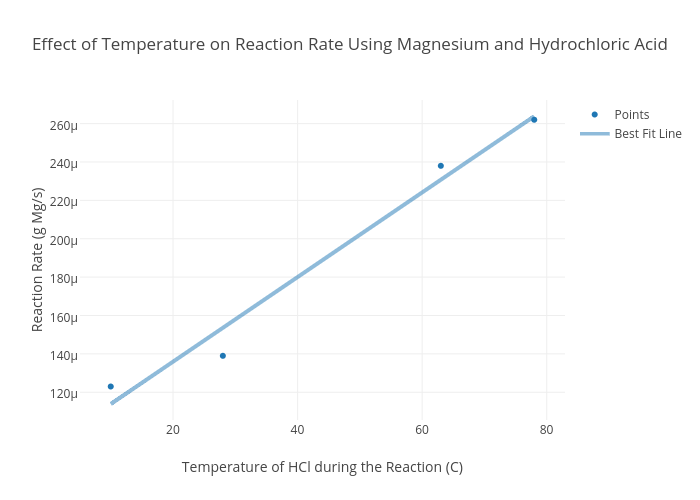
Iloshako's interactive graph and data of "Effect of Temperature on Reaction Rate Using Magnesium and Hydrochloric Acid" is a scatter chart, showing Points vs Best Fit Line; with Temperature of HCl during the Reaction (C) in the x-axis and Reaction Rate (g Mg/s) in the y-axis.. The x-axis shows values from 5.990342908584991 to 82.00965709141501. The y-axis shows values from 0.00010555920009870704 to 0.0002721338040868242.