Edit chart
Loading graph
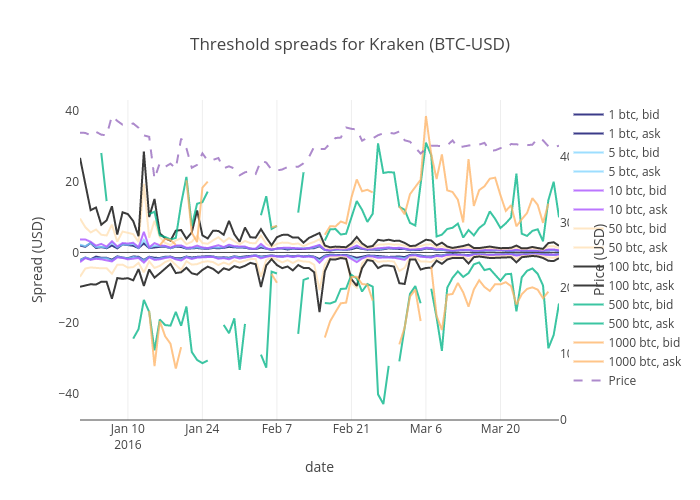
Ilkhem's interactive graph and data of "Threshold spreads for Kraken (BTC-USD)" is a line chart, showing 1 btc, bid, 1 btc, ask, 5 btc, bid, 5 btc, ask, 10 btc, bid, 10 btc, ask, 50 btc, bid, 50 btc, ask, 100 btc, bid, 100 btc, ask, 500 btc, bid, 500 btc, ask, 1000 btc, bid, 1000 btc, ask, Price; with date in the x-axis and Spread (USD) in the y-axis.. The x-axis shows values from 1451602800000 to 1459375200000. The y-axis shows values from -47.33591863247862 to 43.073469401709396.