Edit chart
Loading graph
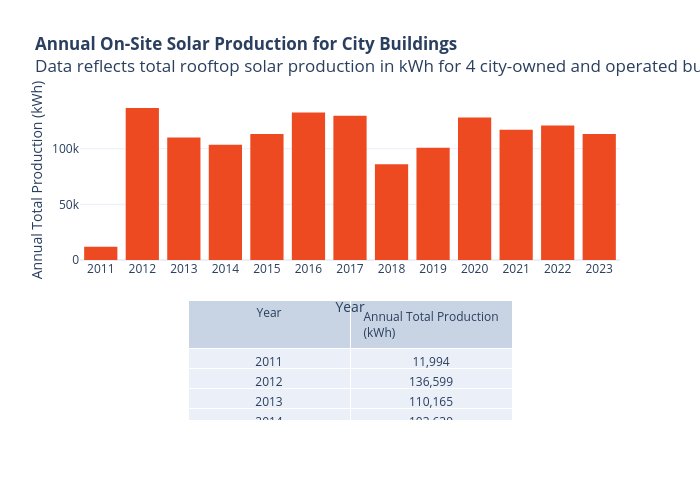
Ida.sihvonen's interactive graph and data of "Annual On-Site Solar Production for City BuildingsData reflects total rooftop solar production in kWh for 4 city-owned and operated buildings." is a bar chart; with Year in the x-axis and Annual Total Production (kWh) in the y-axis.. The x-axis shows values from 2010.5 to 2023.5. The y-axis shows values from 0 to 143788.42105263157.