Edit chart
Loading graph
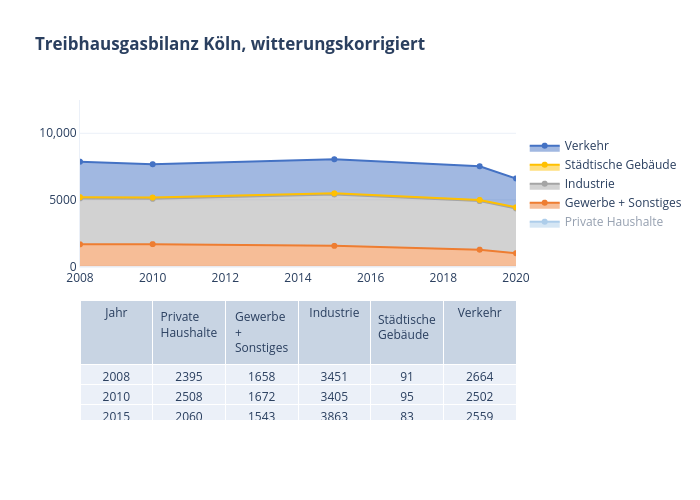
Ida.sihvonen's interactive graph and data of "Treibhausgasbilanz Köln, witterungskorrigiert" is a , showing Private Haushalte, Gewerbe + Sonstiges, Industrie, Städtische Gebäude, Verkehr. The x-axis shows values from 2008 to 2020. The y-axis shows values from 0 to 12500.