0.0033
0.00332
0.00334
0.00336
0.00338
0.0034
0.00342
0.00344
0.00346
−2.2
−2.1
−2
−1.9
−1.8
−1.7
Col2
Col2 - fit
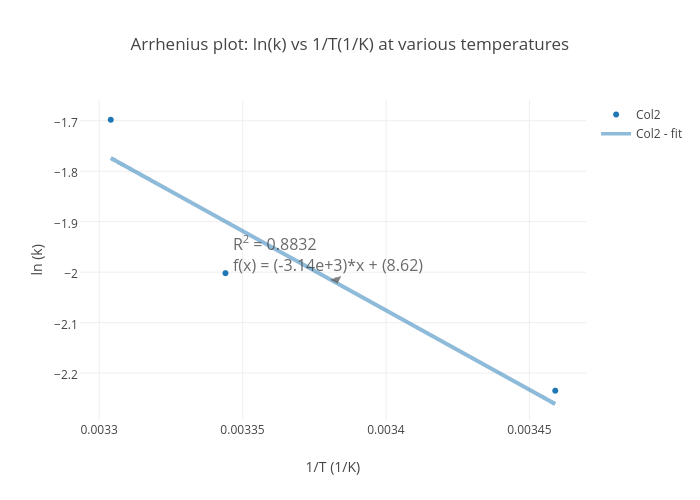
Arrhenius plot: ln(k) vs 1/T(1/K) at various temperatures
1/T (1/K)
ln (k)
R
2
= 0.8832
f(x) = (-3.14e+3)*x + (8.62)
plotly-logomark
Edit chart
Huangrunzhi27's interactive graph and data of " Arrhenius plot: ln(k) vs 1/T(1/K) at various temperatures " is a scatter chart, showing Col2 vs Col2 - fit; with 1/T (1/K) in the x-axis and ln (k) in the y-axis.. The x-axis shows values from 0.0032944904006677795 to 0.0034685095993322204. The y-axis shows values from -2.292924644004095 to -1.6604935399849698. This visualization has the following annotation: R2 = 0.8832f(x) = (-3.14e+3)*x + (8.62)